We’re reimagining Time Series Analytics with the release of Beacon Plot Pro. This powerful application enables you to visualize time series and apply transformations to them, to produce sophisticated analytics with your derived dataset.
The user interface has two primary elements: a dynamic charting area, and an expression editor underneath it.
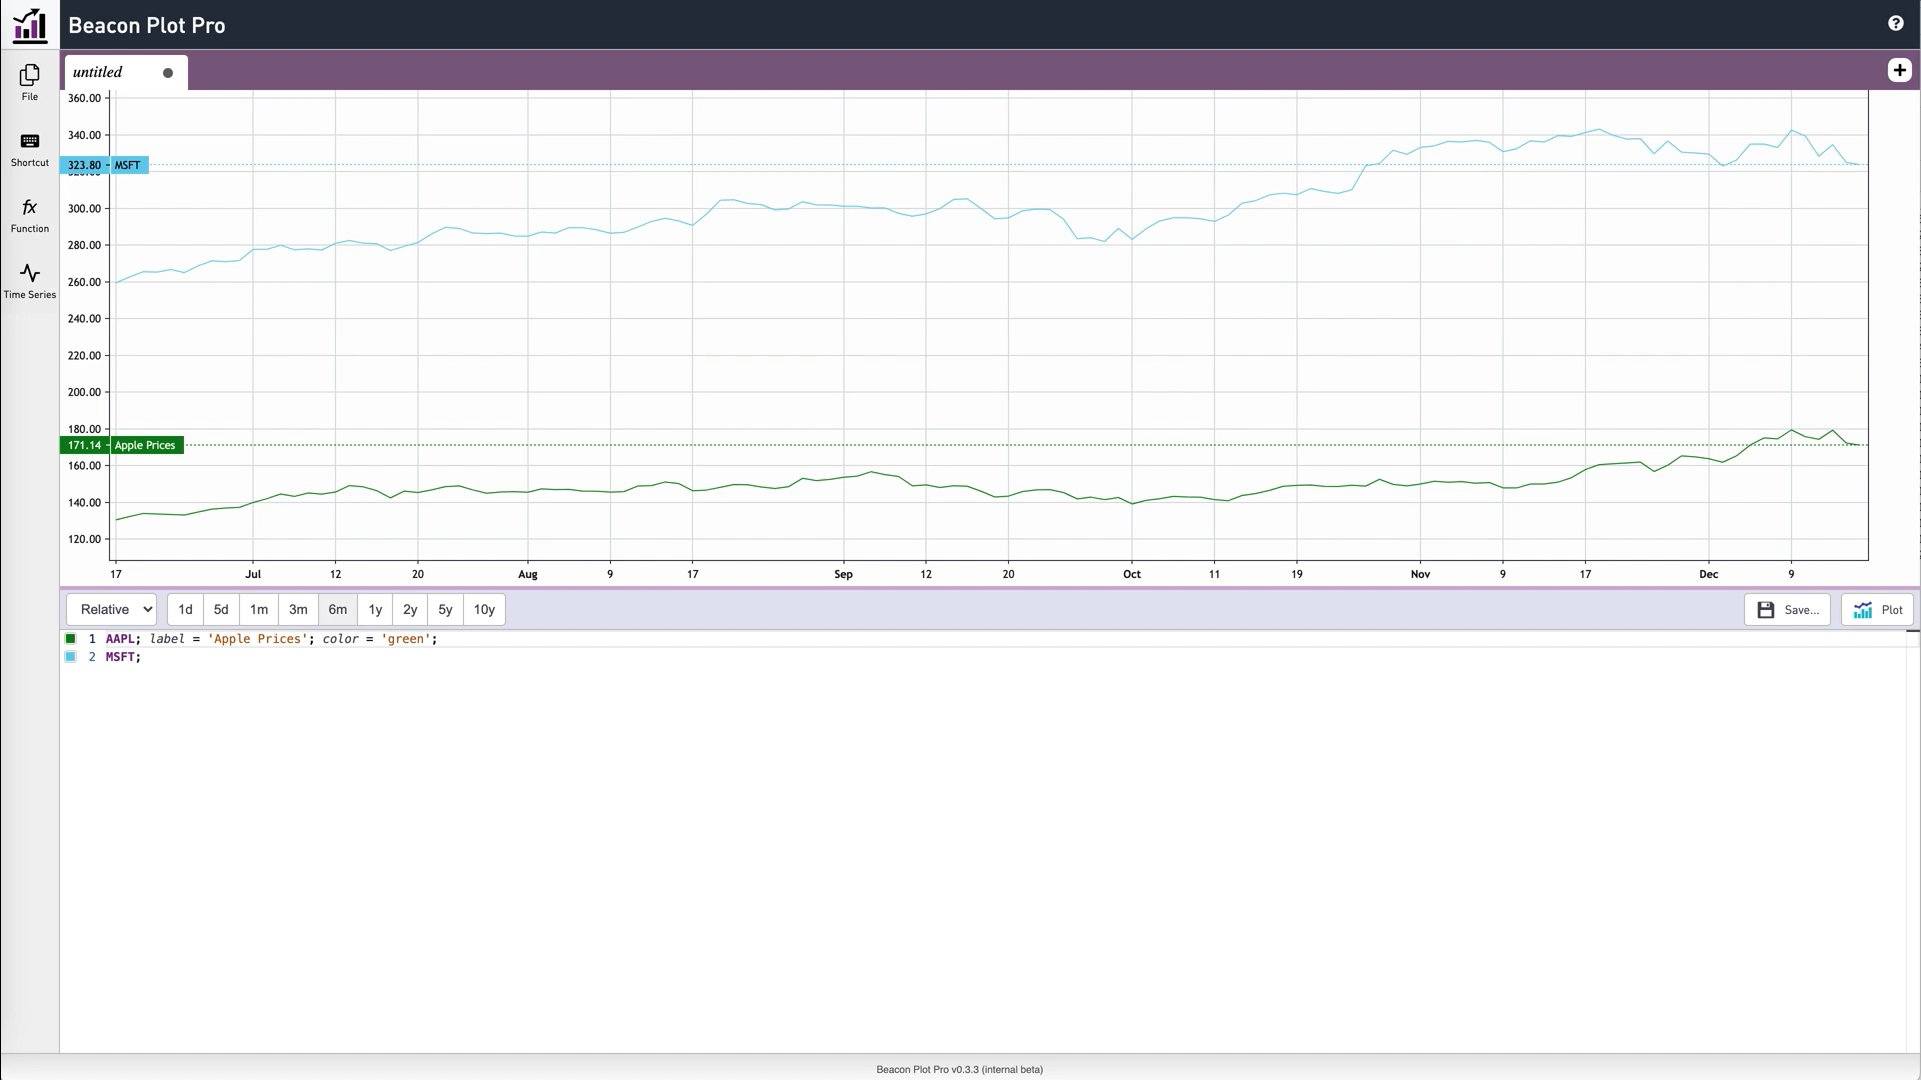 Figure 1: Beacon Plot Pro user interface, showing the chart area and the expression editor
Managing Chart Attributes
You can plot multiple time series on the same chart. You can add labels and colors to distinguish different series, and assign them to either the left or right axis. You can choose from various chart types, including lines, histograms, and candlesticks.
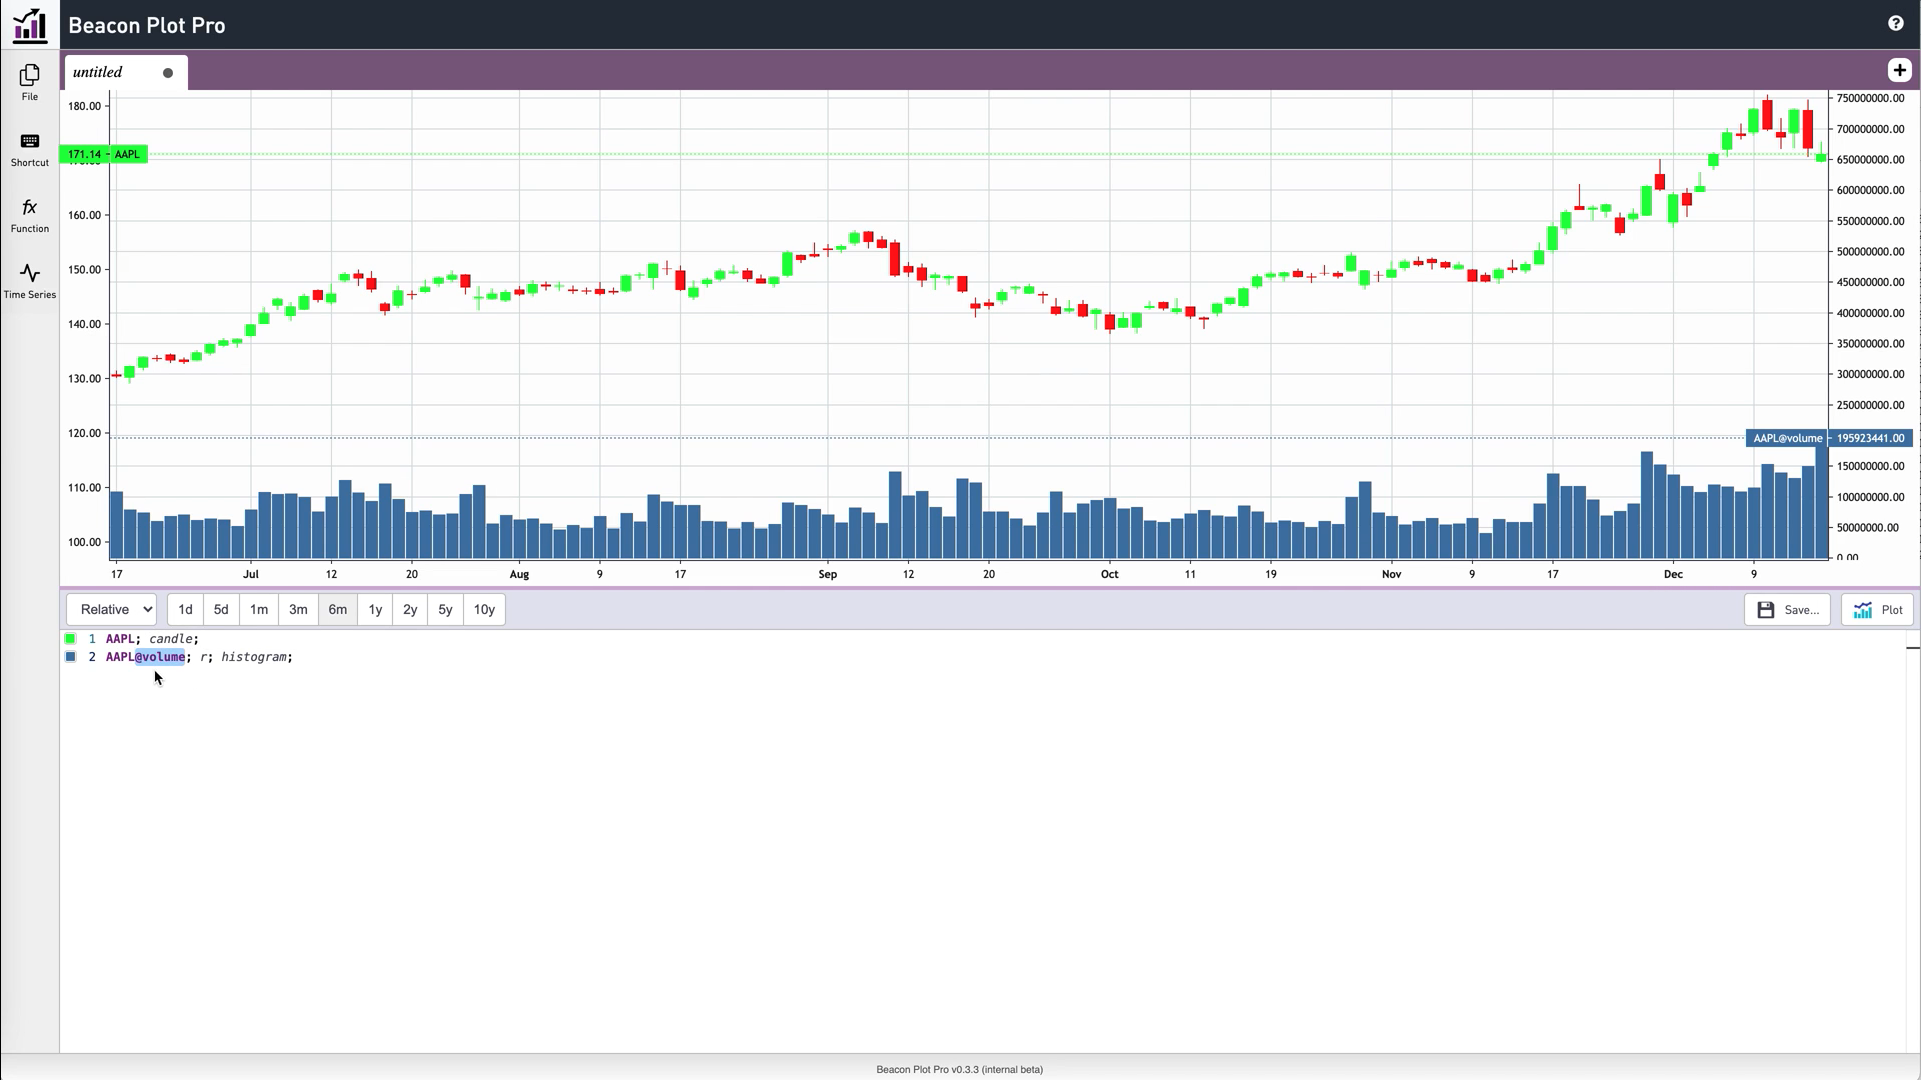
 Figure 2: Beacon Plot Pro with candlestick chart showing stock prices on the left axis, and trading volumes on the right axis
Searching for Time Series
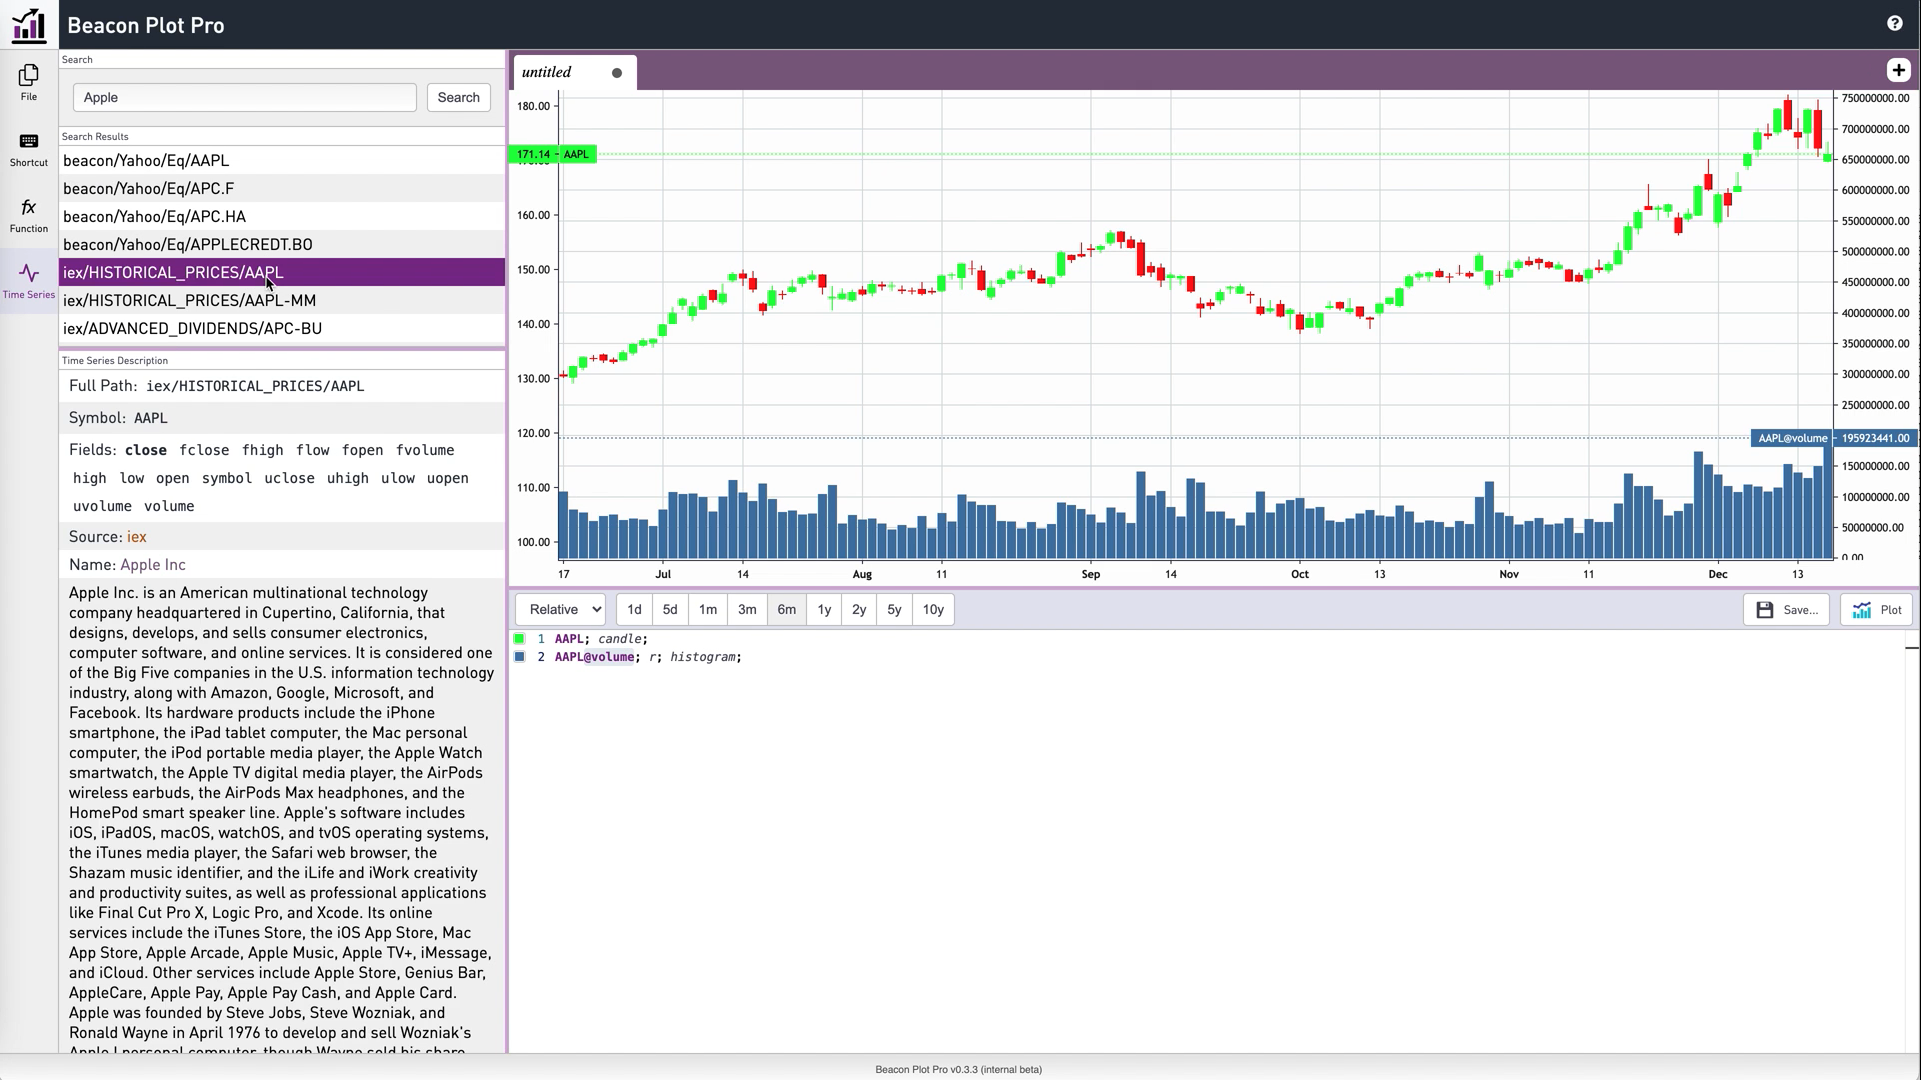
Data for Plot Pro can come from your internal datasource integrated into Beacon, or from external data providers, such as CME and IEX, made readily accessible via our Market Data plugin architecture. The same data is readily available to other applications running on the Beacon Core platform via the integrated data fabric. You can search for available time series based on ticker or keywords, and immediately see the list of available fields within each series. For example, a stock price series will typically include high, low, open, close, and volume data. Default data fields are highlighted in bold. Fields are clickable, making it easy to insert the desired selection into the expression editor for plotting.
Figure 3: Beacon Plot Pro time series slider panel showing options that match “Apple” and the available fields
Calling Additional Functions
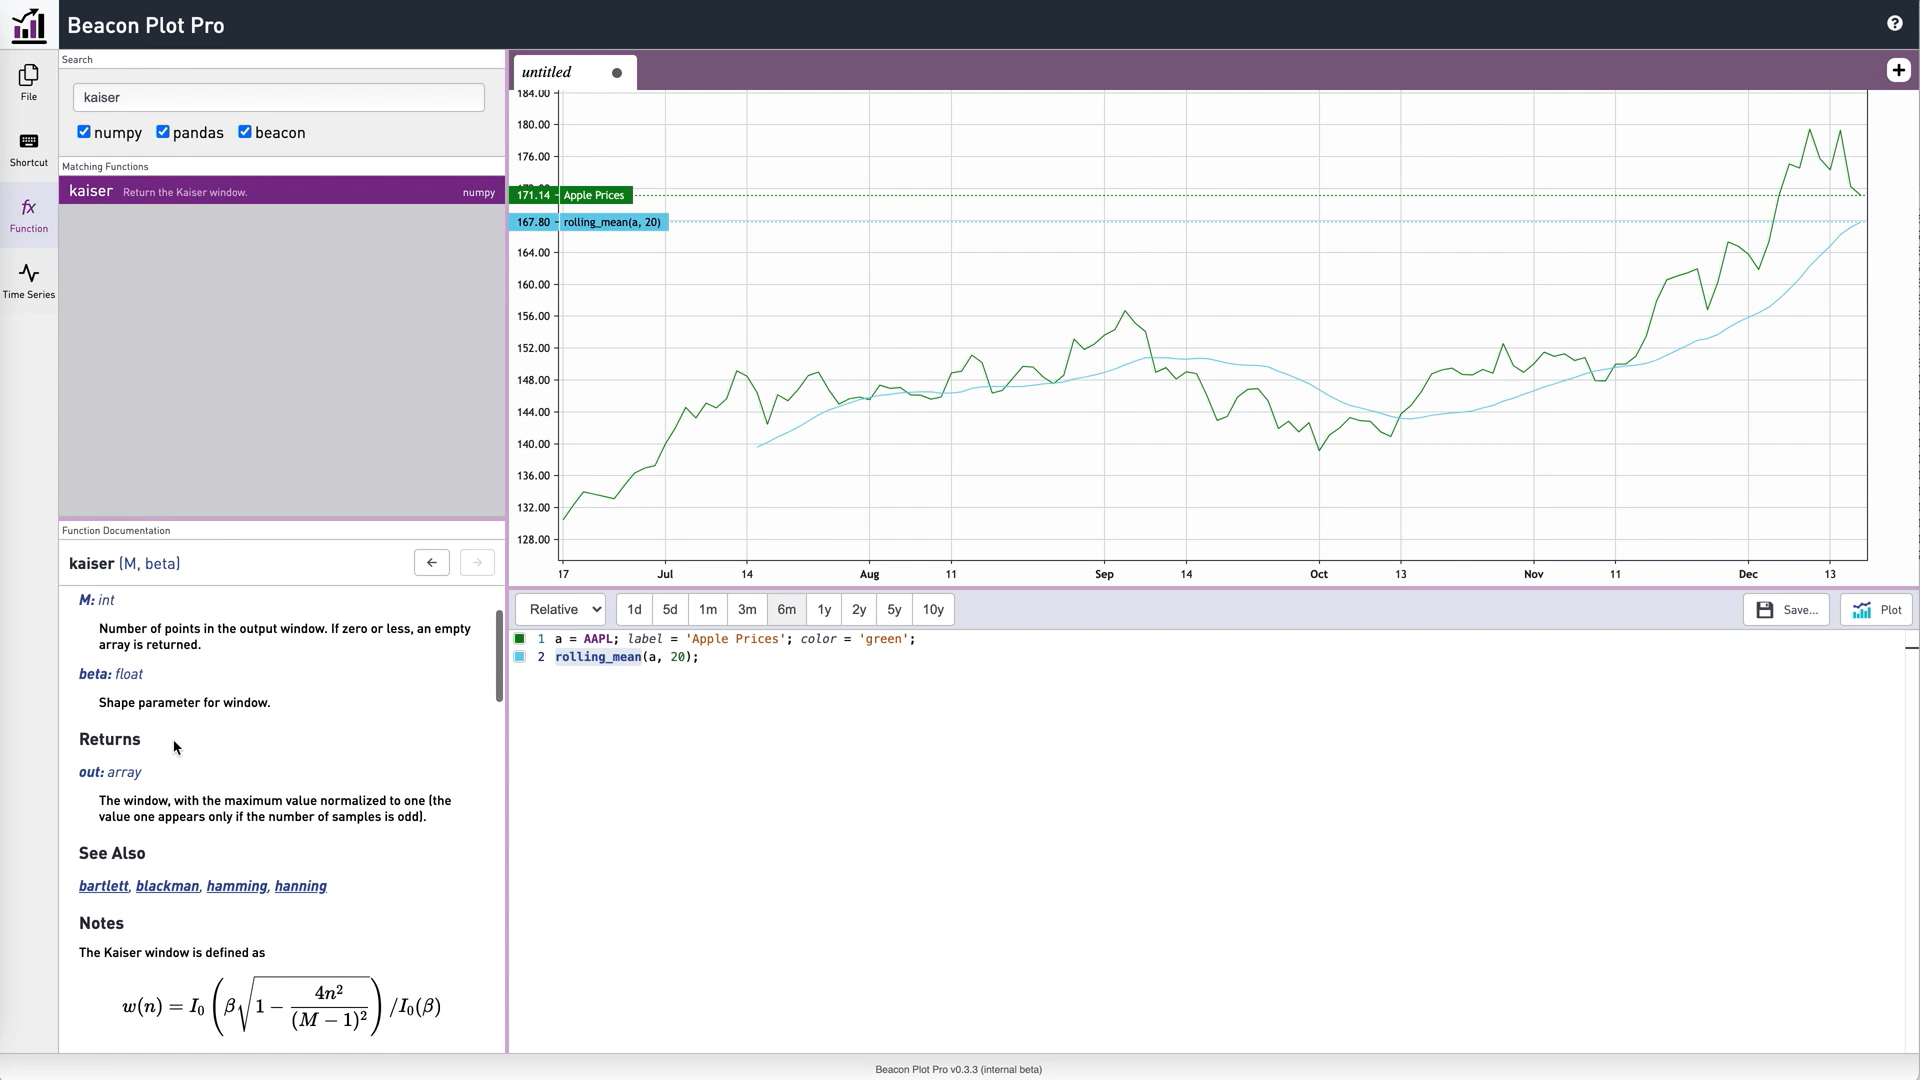
The expression editor and function browser demonstrate the full power of Plot Pro. A time series can be assigned to a local variable to apply transformations. The expression editor includes an auto-completion feature when typing function names, and provides a pop-up side panel that lists all available functions, or just those that match a certain category or what you are typing. Inline documentation explains how the function works, lists the necessary parameters, and what the function returns.
Figure 4: Beacon Plot Pro pop-up side panel showing list of matching functions and supporting documentation
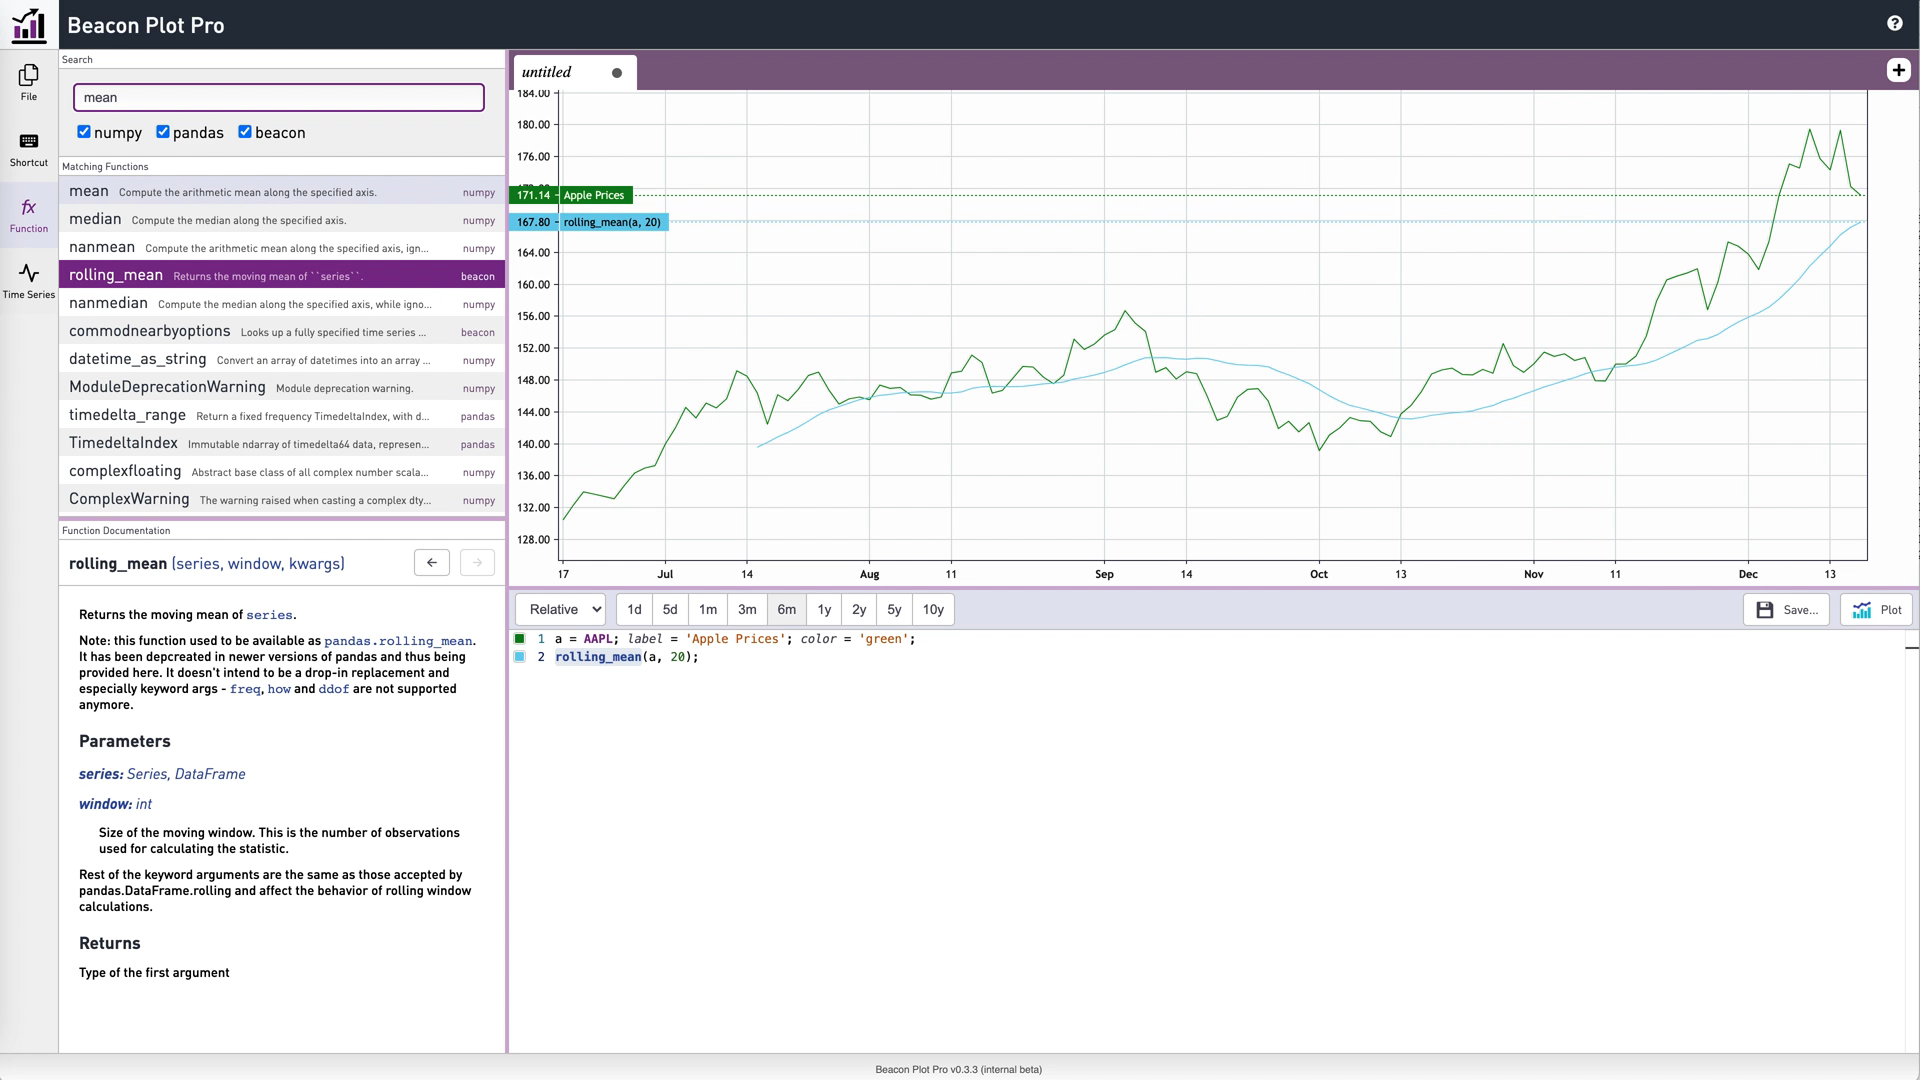
You can use a wide range of mathematical and financial functions, including those provided by Beacon as well as pandas and numpy. You can also extend this functionality to include your custom time series transformation functions via the Beacon IDE. The functions side panel can display mathematical notation, tables, code blocks, and links to related functions, enabling you to quickly locate the best function for your needs.
Figure 5: Beacon Plot Pro function side panel, showing mathematical notation of details
Part of a Full Suite of Applications
Beacon Plot Pro is part of Beacon’s suite of cross-asset applications for research, trading, portfolio and risk management, and workflow automation. Beacon provides transparent access to the source code of the platform for customers, making it easy for customers to enhance these capabilities and integrate their own proprietary analytics, quant libraries, data sets, or other applications. To see Beacon Plot Pro in action, watch the video demo.
[embedyt] https://www.youtube.com/watch?v=dbq2OnjGWjU[/embedyt]