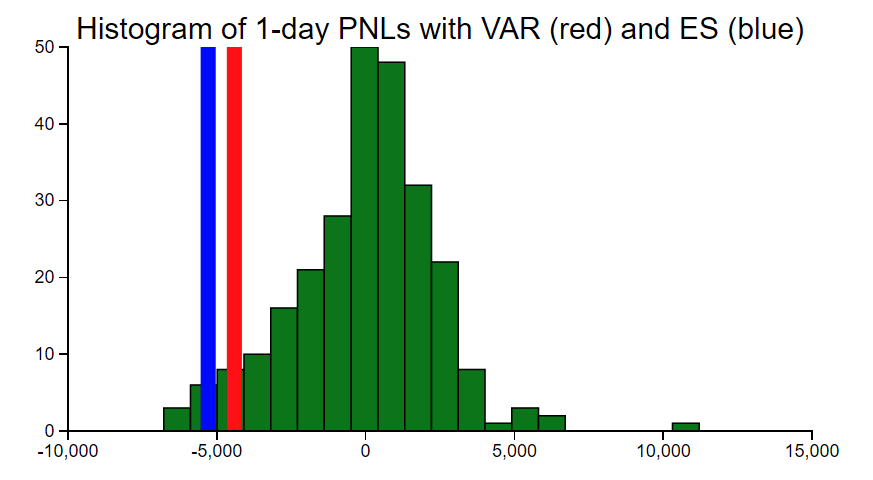
Value at Risk (VaR) is a mainstay of risk management, giving a clear picture of the size and probability of daily loss for a given portfolio. For example, if the VaR of a portfolio is $100,000 at 95%, that means there is a 5% probability of a loss of $100,000 or more. While many other risk reports are asset-class specific, one of the key benefits of VaR is that it is a cross-asset calculation that can apply to all of the assets in a portfolio.
Different types of VaR calculations
Beacon provides two different types of VaR models in our Front Office Suite, along with other useful calculations.
- Historical VaR – This calculation fully reprices the selected portfolio using all observed historial market shocks in the specified time period. Market shocks are mapped on the current market state to simulate the market at the close of the next business day.
- Variance/Covariance VaR – This calculation builds a historical covariance matrix of market shocks due to various factors. Deltas, vegas, and other relevant sensitivities are calculated so that the PnL can be modeled as linear in each factor and normally distributed overall.
Beacon VaR reports include an Expected Shortfall (ES) calculation. This is the size of the expected loss or shortfall in the event that PnL is worse than the VaR. For example, in the portfolio example above with 95% VaR of $100,000, the ES might be $120,000.
VaR reports cover a wide range of risk categories, including market prices, implied volatilities, and interest rates. Like other risk functions, these reports can be run on a portfolio, book, or pre-trade basis, and can be customized by choosing which categories of risk to include, the desired confidence level, and the historical time period to use. Results are returned quickly using the elastic compute capabilities of Beacon Core, and can also be set up for end-of-day reporting with the Bob job scheduling dashboard.
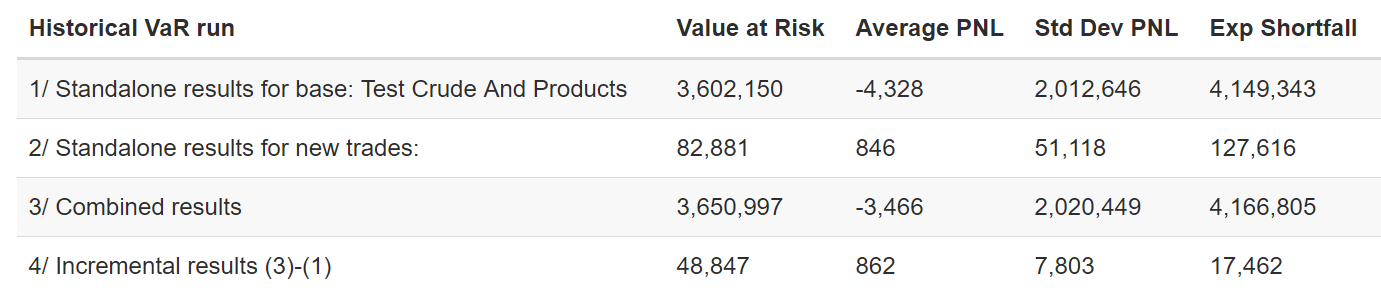
Incremental VaR
Another valuable use of VaR calculations is evaluating the impact of a trade on the overall risk. Incremental VaR displays the potential loss before and after the trade, clearly illustrating the effects on the portfolio of increased diversification or concentration. In this example, the VaR of the assets is $82,881 by themselves, but this falls to $48,847 when included in the broader portfolio.
Importance of good data and proxy markets
VaR calculations are based on historical data. Keeping the data complete and accurate for all of the relevant markets can be challenging, especially for portfolios that are complex, span multiple markets and asset classes, or change frequently. A few bad data points can cause a significant and adverse impact on the calculation. While keeping good data should be the priority to reduce operational risk, Beacon provides the option to use proxy markets for missing data. Users can choose the most appropriate market to use as a substitute in the event of missing data, and the reports clearly indicate when a proxy substitution has occurred. Proxy data provides operational robustness, enabling the reports to run successfully even when the data is incomplete.
Part of a solid financial engineering foundation
As a cross-asset platform, Beacon provides clients with a consolidated view of Value at Risk and Expected Shortfall that can be difficult to obtain with asset-specific systems. Beacon’s VaR functionality is built on top of the company’s financial engineering foundation, leveraging integrated market data and instrument pricing logic. In addition, all VaR calculations are done with Beacon’s Gromit dependency graph, dramatically reducing the compute time and resources required, often by orders of magnitude. Whether you are running VaR over the last 60 days or 10 years, across a small asset base or a broad and varied portfolio, Beacon’s enterprise scale and distributed compute model speeds up calculations to get you updated risk information when you need it.