Beacon Platform makes it easier to manage the elastic compute functionality of cloud providers. To help you keep track of compute usage as elastic CPU capacity automatically scales up and down, we have developed a simple management app. Available in the Beacon App Store, the Pool Cost Dashboard app tracks Amazon AWS machine costs and host uptimes for both steady-state and on-demand services running in your Beacon Domain.
Using the Pool Cost Dashboard App
After installing from the Beacon App Store, you will see an icon on your Beacon desktop. The installation process automatically schedules batch jobs to collect regional AWS on-demand pricing by machine type and track host uptime in your domain. The app then creates an hourly snapshot of the costs grouped by pools, such as apps and jobs.
Launching the App

The app launches with a Dashboard view showing one week of hourly data.
Figure 1: Reviewing one week of compute scheduling and activity
In the view above, you can see compute usage dropping over the weekend as Beacon’s elastic compute scheduler shuts down unused pools. The blue portion at the bottom of the chart represents the always-on services that are essential to keep the domain up and running, including infrastructure, database, and vault services. The compute usage for these services should be relatively consistent through the domain’s lifecycle.
The details for on-demand services are layered on top, clearly displaying the variance in usage.
Reviewing details
You can access more granular plots from the Detail View tab. Within the plot, you can click on a series to toggle its visibility, or double click on it to highlight a single pool. For example, in the “apps” pool in Figure 2, below, you can see the usage of the pool increasing during the day as users launch apps to work on their tasks, and subsequently the usage going to zero as the pool gets shut down over the weekend. You only pay for what you use!
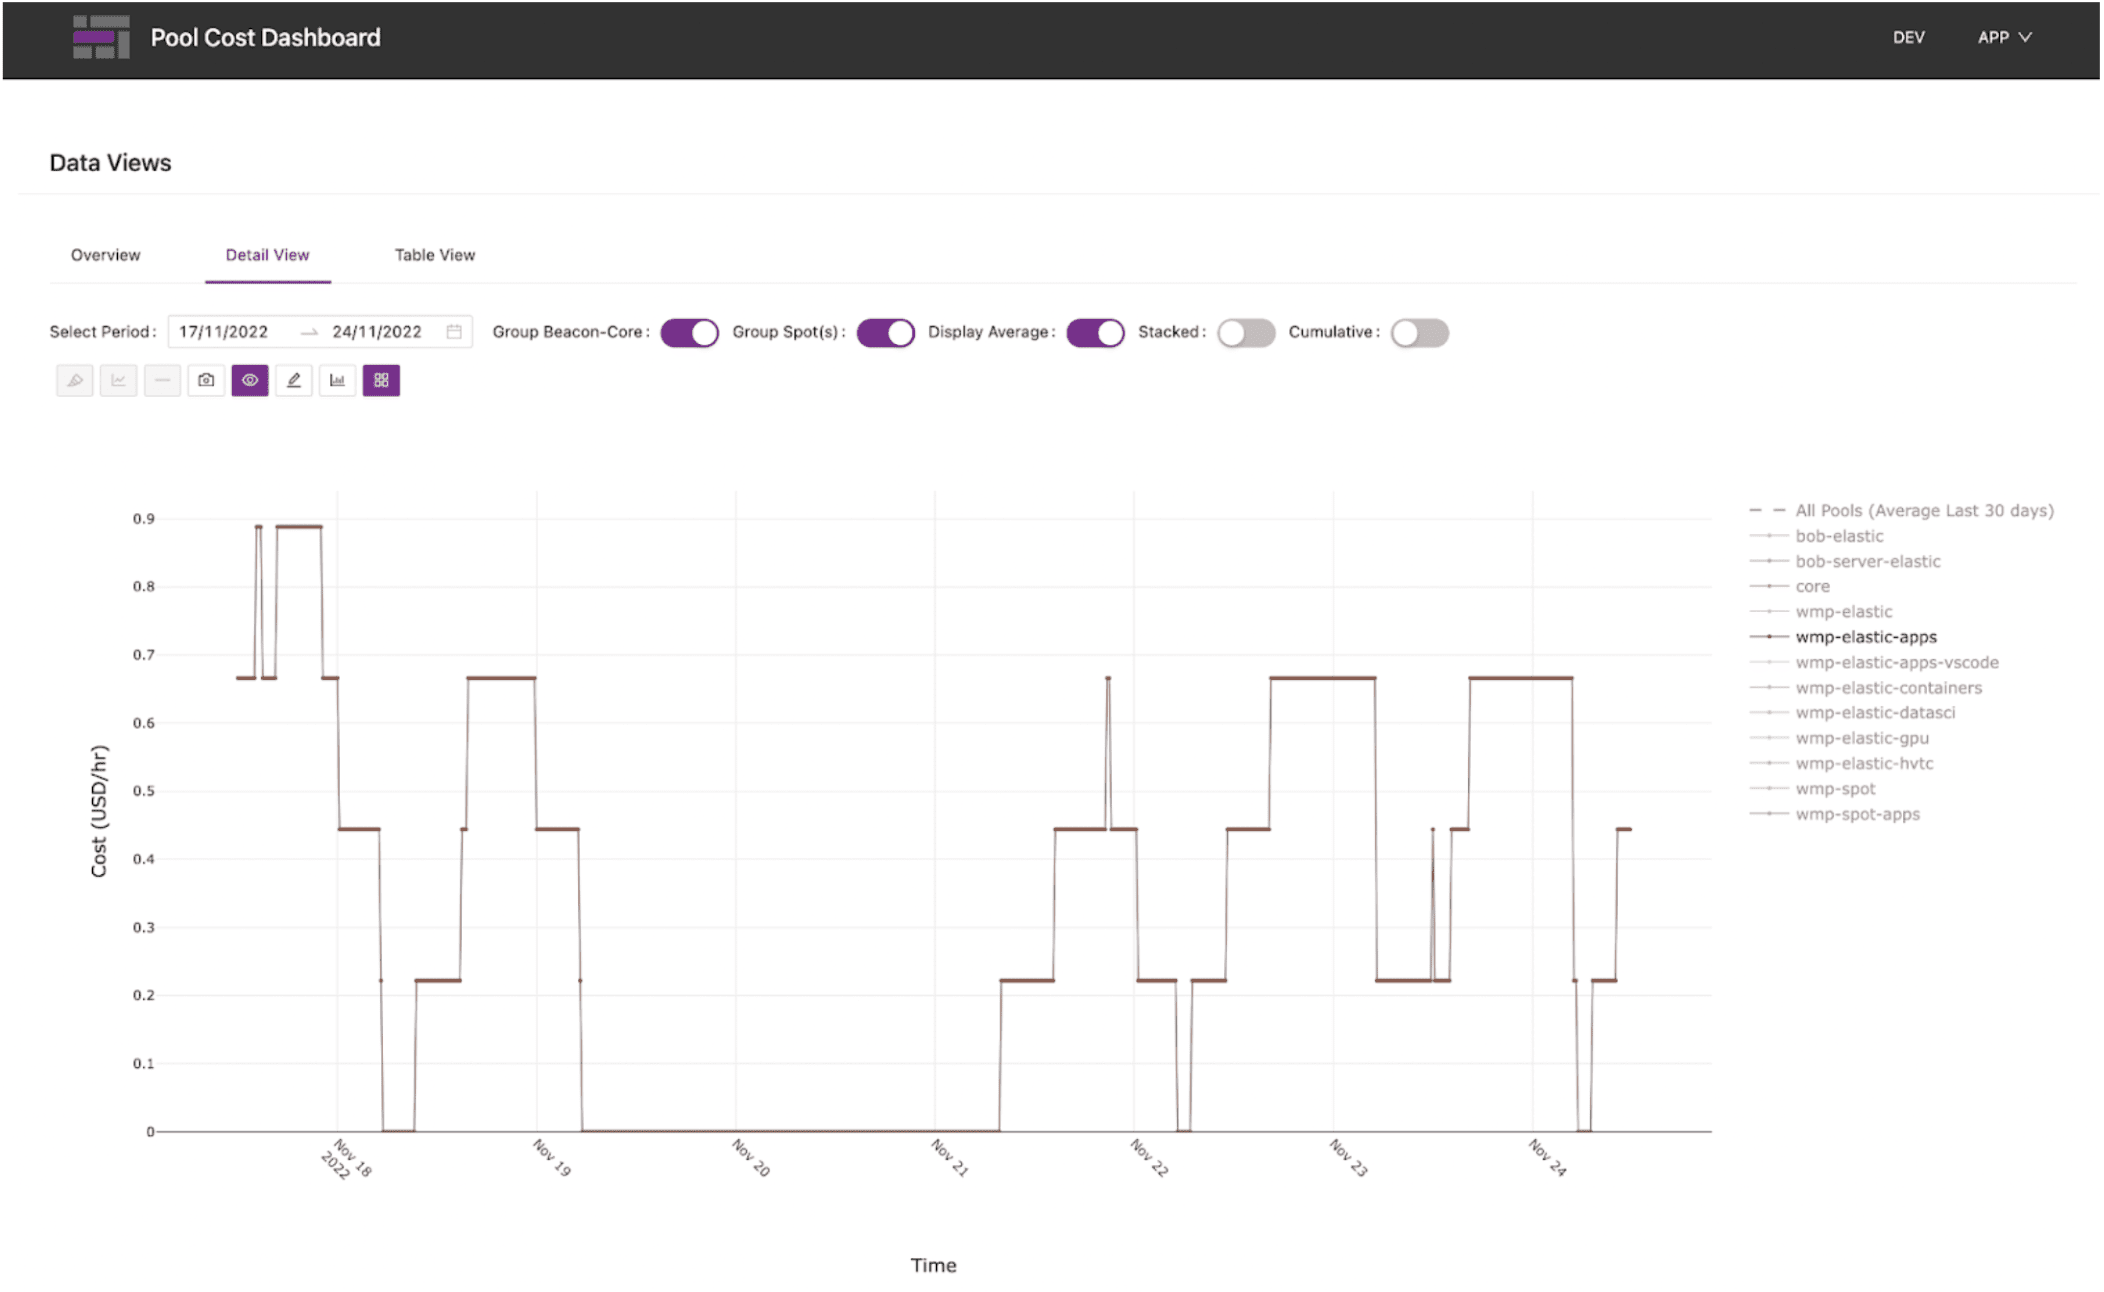
Figure 2: Detailed compute cost by individual pool
There is also a cumulative view that displays the aggregate pool costs over time.
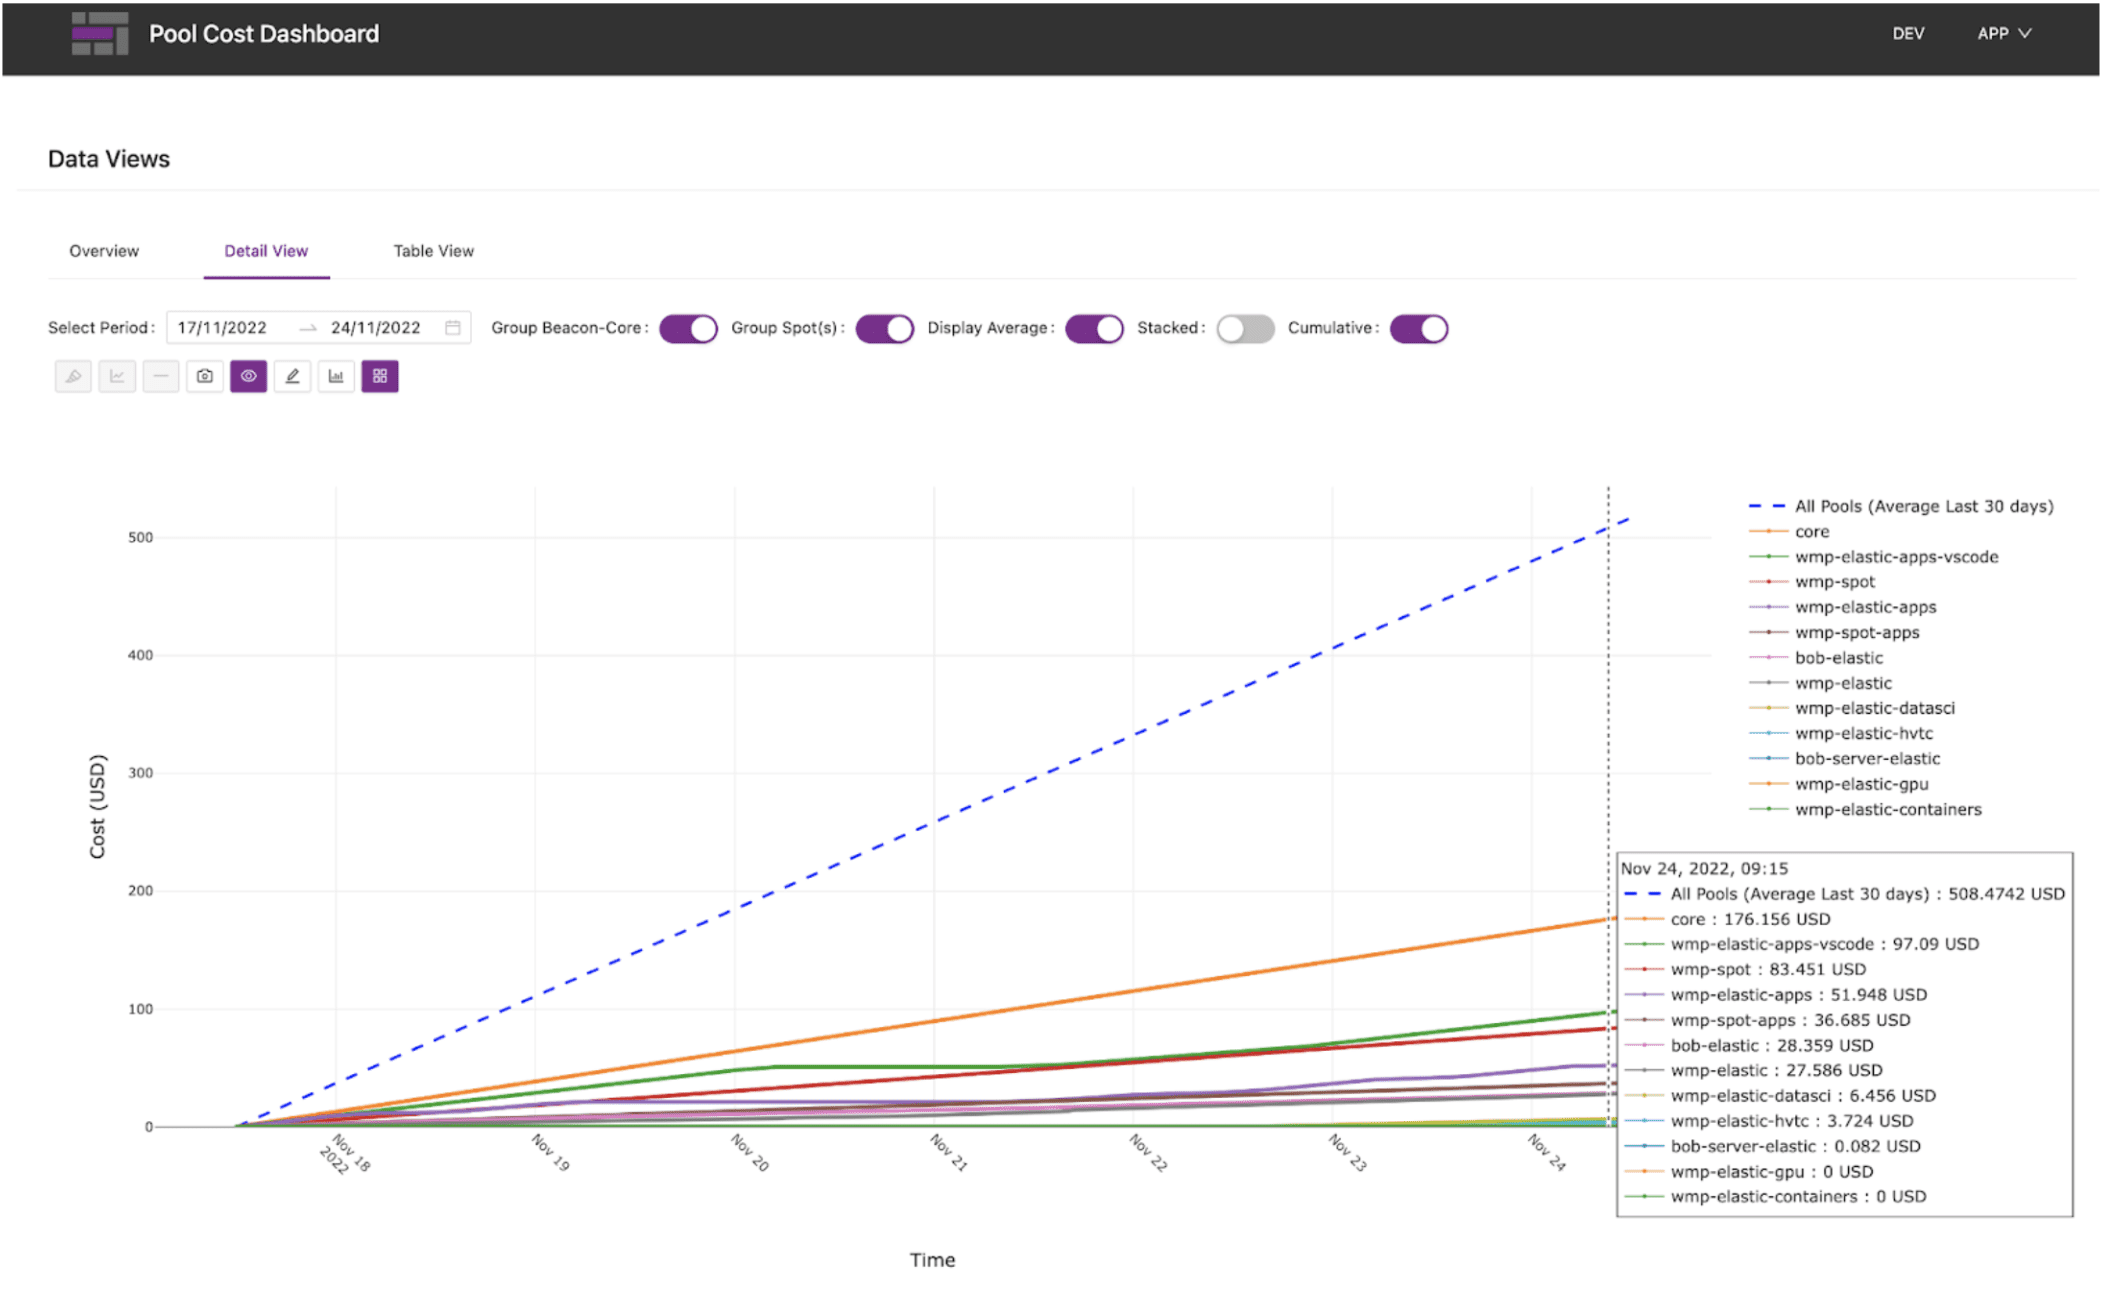
Figure 3: Cumulative compute costs by pool
Downloading data
If you want to do further analysis on your compute usage, you can download the raw data as a CSV file.
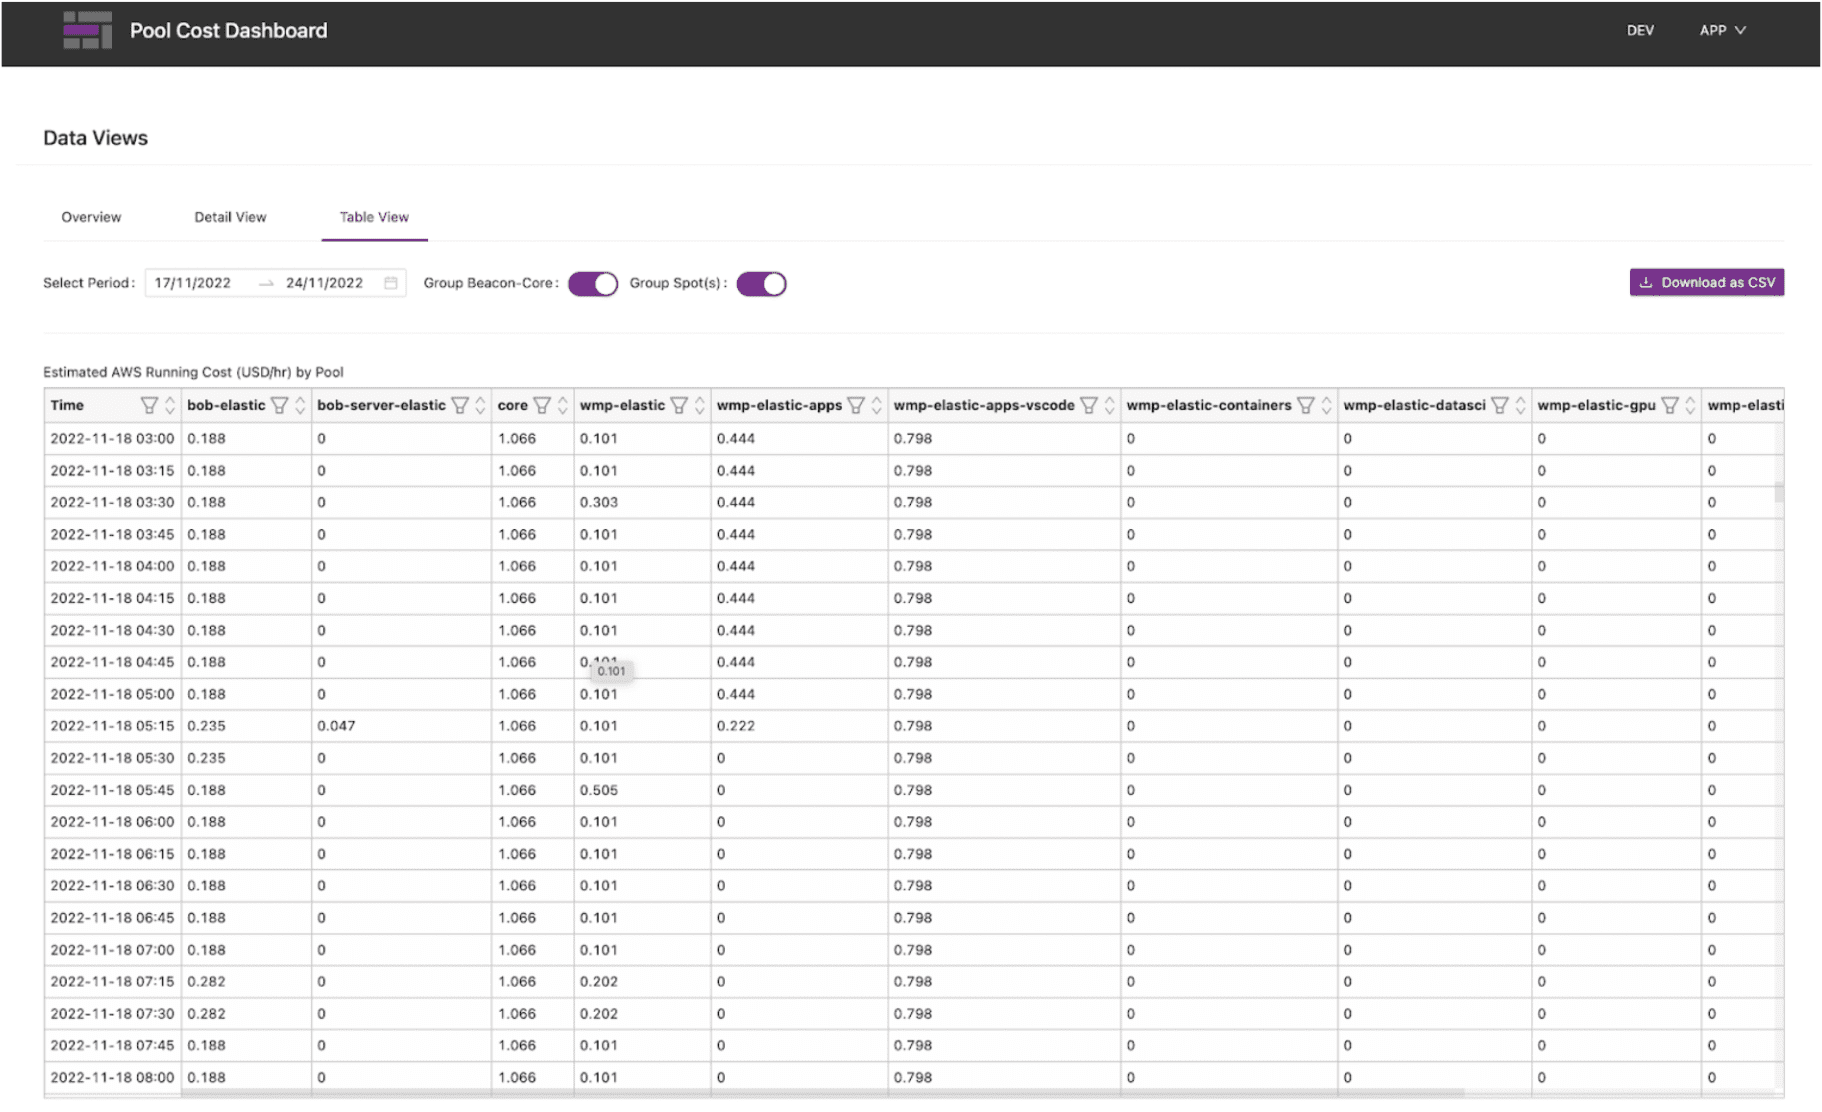
Figure 4: Downloading raw data for additional analysis
You can also open the time series in Beacon Plot and use the built in time series analytics functions for your own analytics.
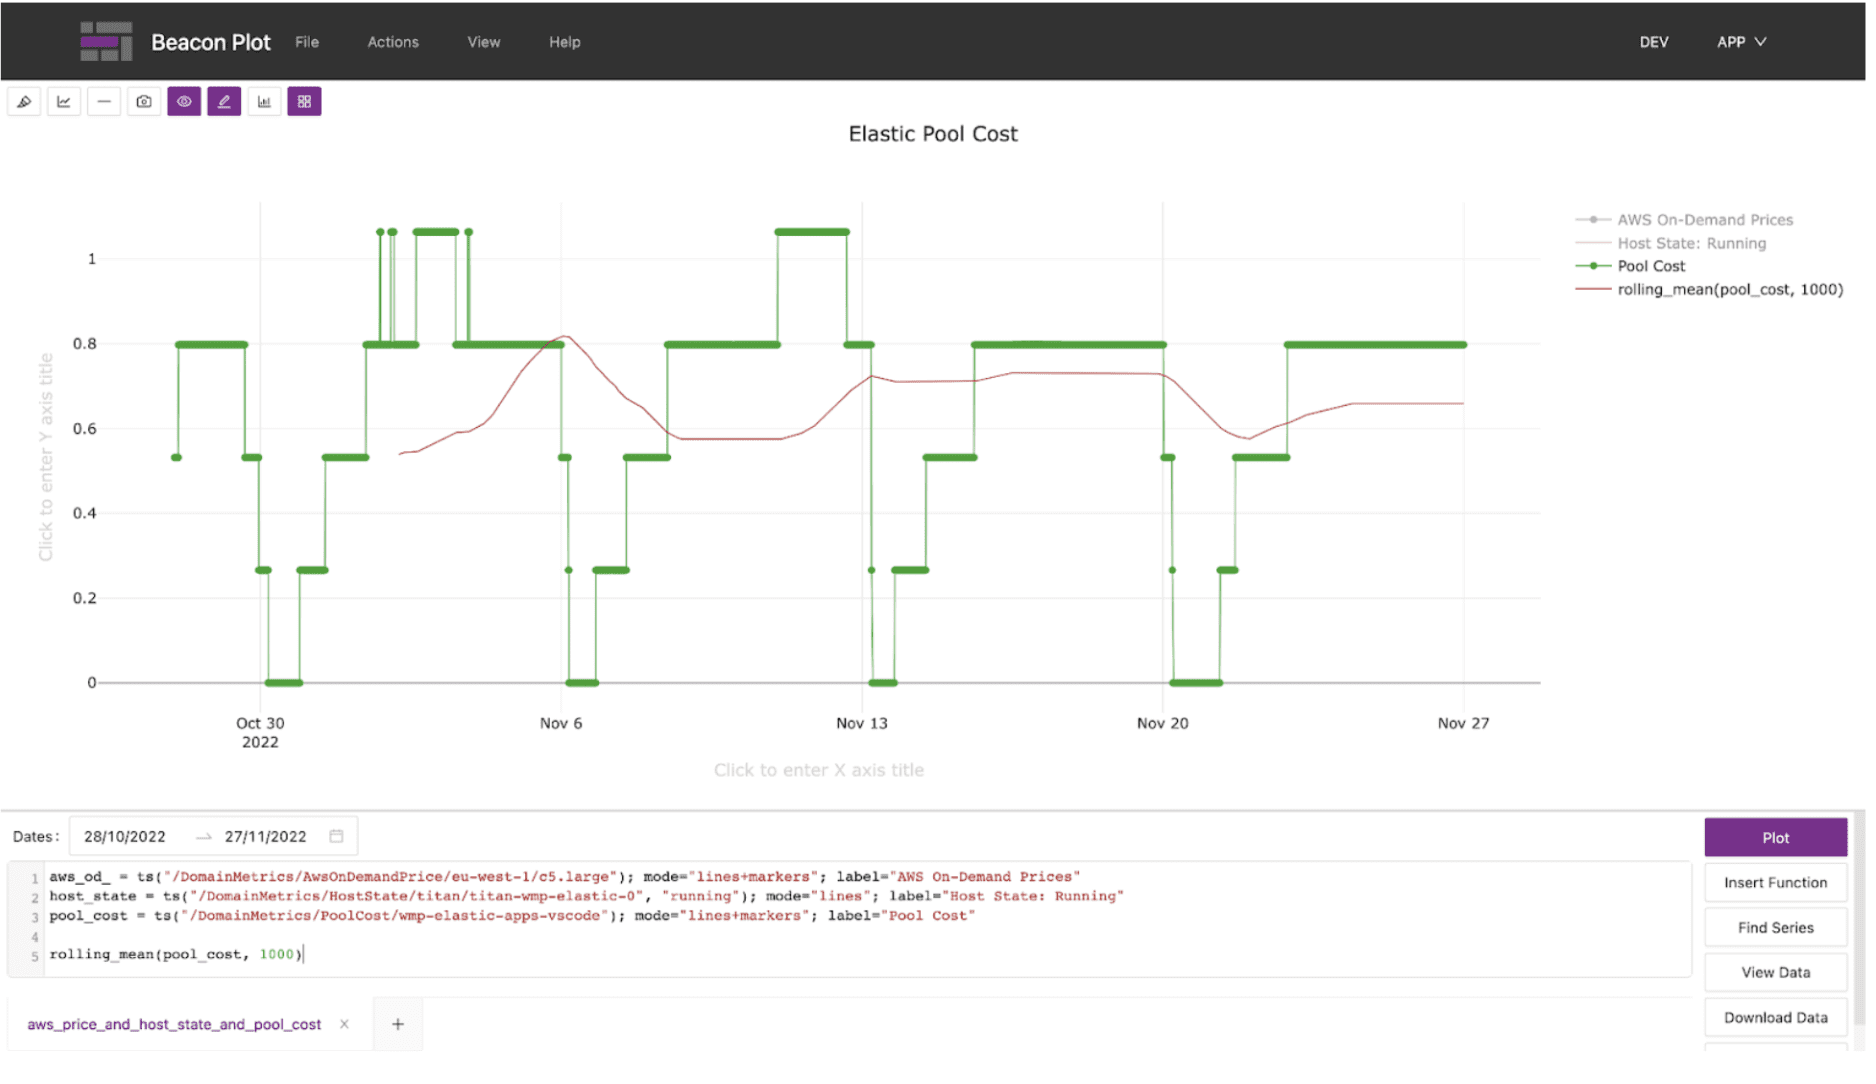
Figure 5: Custom pool cost analytics with Beacon Plot
Summary
If you want a quick view into your Beacon domain’s compute usage and associated costs, there’s an app for that. Simply install the Pool Cost Dashboard app from the Beacon App Store and you will start capturing this data. Then start looking for actionable insights such as tuning your capacity requirements and right sizing your compute needs.
More info for Beacon clients is available on the Beacon Docs portal.